



Hi everyone!
I’m currently using Fornax for data analysis and noticed that DS9 isn’t available in the environment. I was wondering if users are allowed to install DS9 (or other PGPLOT-related tools) on their own. If self-installation isn’t supported, are there any plans to add DS9 or similar visualization tools to Fornax in the future? Thanks in advance for any guidance!
Hi, welcome to Fornax!
We are not planning on providing a built-in installation of DS9, nor on supporting user installs. Essentially no PGPLOT related plotting will be supported on Fornax - XSPEC for instance (if you’re familiar with it, if not it’s an X-ray spectral fitting code that uses PGPLOT) has been configured just to write plots to disk, rather than open a plotting window.
That decision is driven by security considerations related to piping graphics outputs to/from Fornax, and by how unstable the potential solutions can be - DS9 etc. were never really designed for this sort of computing environment, and we’re trying to provide tools that were created for cloud computing/Jupyter interfaces. There is a javascript-based version of DS9 called JS9 that we considered, but it is no longer actively maintained, and as such we can’t really justify providing it.
All of that said, we do provide the ‘Firefly’ tool developed at IPAC ( GitHub - Caltech-IPAC/firefly: Web-based UI library for astronomical data archive access and visualization · GitHub ), which can be used to interact with and view fits images on Fornax.
Firefly can be opened from the Jupyter launcher (click on the blue plus in the top left of your screen to open it) - once open, you can go to the ‘upload’ tab, drag a fits file from your Fornax directories on the left hand side of the Jupyter interface, and then click ‘load image’ in the bottom left of the Firefly window to view/interact with an image.
I hope that some of this was helpful, and I’ll be happy to help you further with this if you need!
Hi @rpandey, Fornax has jupyter-firefly-extensions set up for you which allows you to do the following:
- Start the full Firefly viewer in a tab (either through launcher or command palette) as @djturner explained it above.
- Use
FireflyClientpython interface in notebook to interactively visualize your data (tables, images, charts) by sending it to the Firefly using theFireflyClientpython API. Please refer to firefly_client - Python API to Firefly visualization — firefly_client documentation to learn more about it. - Open any astronomical data file in Firefly by clicking on it from JupyterLab file browser. This enables you to open .fits, .parquet, .vot, .xml, .tbl, .csv, .tsv, etc. file formats within JupyterLab, preview their metadata, and visualize the selected data items as images, tables, or charts in Firefly.
I believe 3rd functionality will be most relevant for your use case. Just try double-clicking on a FITS file you have in file browser, or right-click and select Open with Firefly viewer.
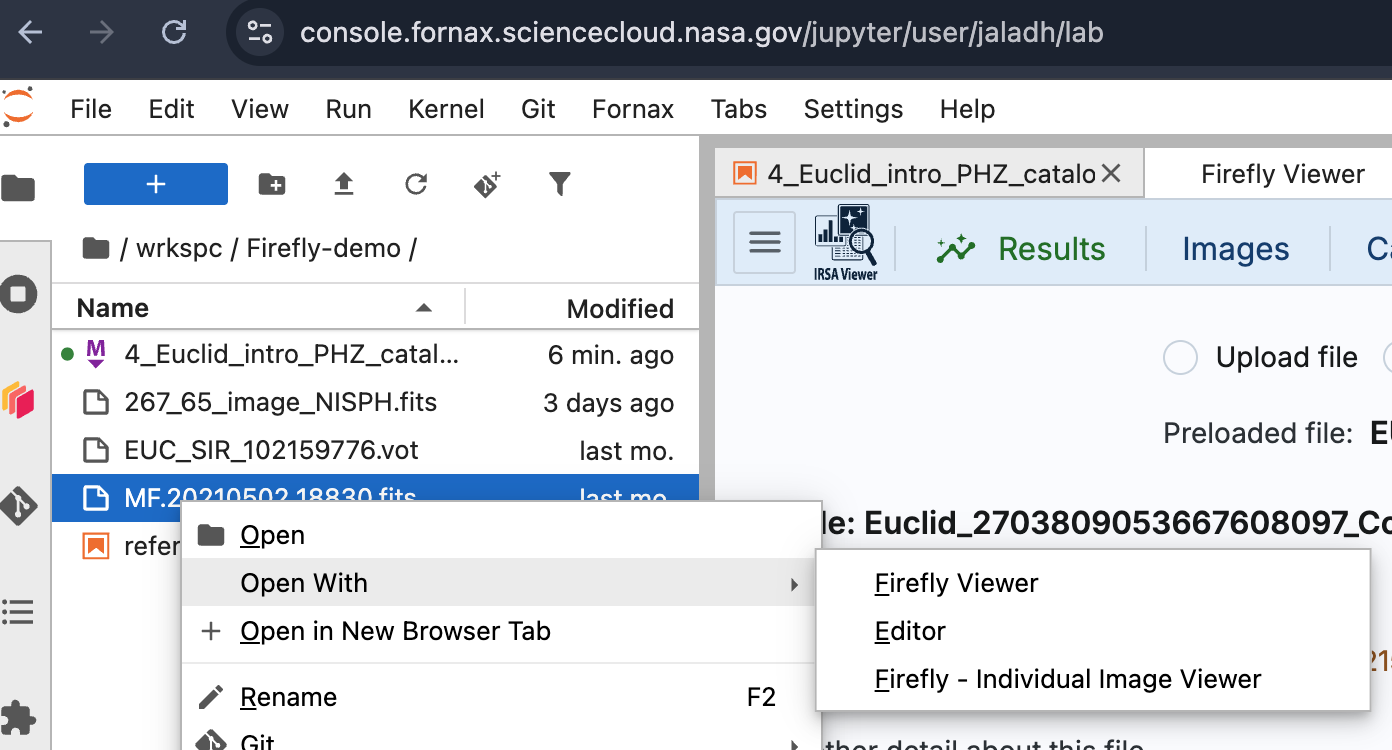
I should note that for large files you may experience some slowness since the Firefly server currently in use (IRSAViewer) is not in Fornax cloud environment at the moment. But we are working on it and it should improve in the future.